The solar energy industry is experiencing rapid, unprecedented growth. In 2023, global renewable energy capacity increased by nearly 50%, the fastest growth in the last two decades. Solar PV energy was responsible for three-quarters of this growth.
With new incentives for renewable energy emerging and solar energy becoming more cost-competitive, investments in solar energy will increase further. In order to reduce investment uncertainty and increase revenue, owners need to understand the risks and losses of their solar farms.
With an industry-leading data model and 250+ GW of industry data — including over 70 GW of solar energy — Clir helps customers better identify losses and risks to assets.
Risks impacting solar assets
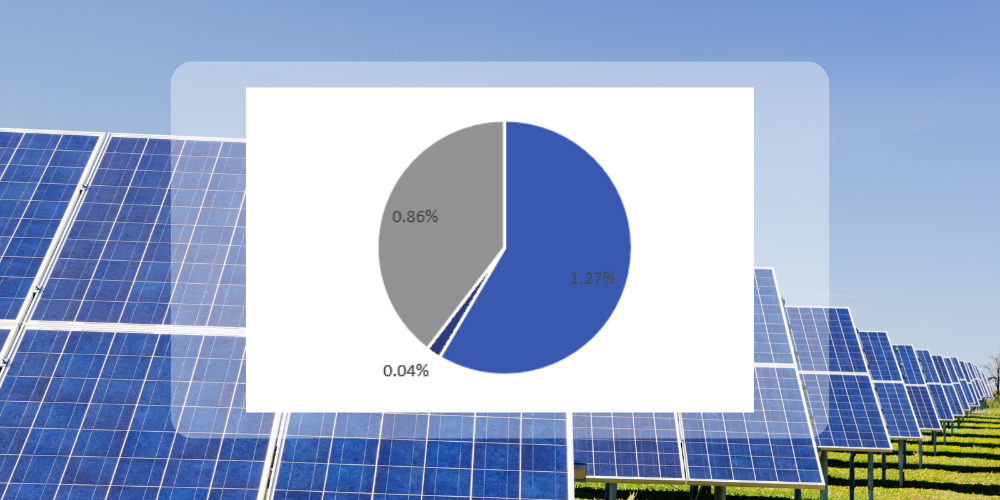
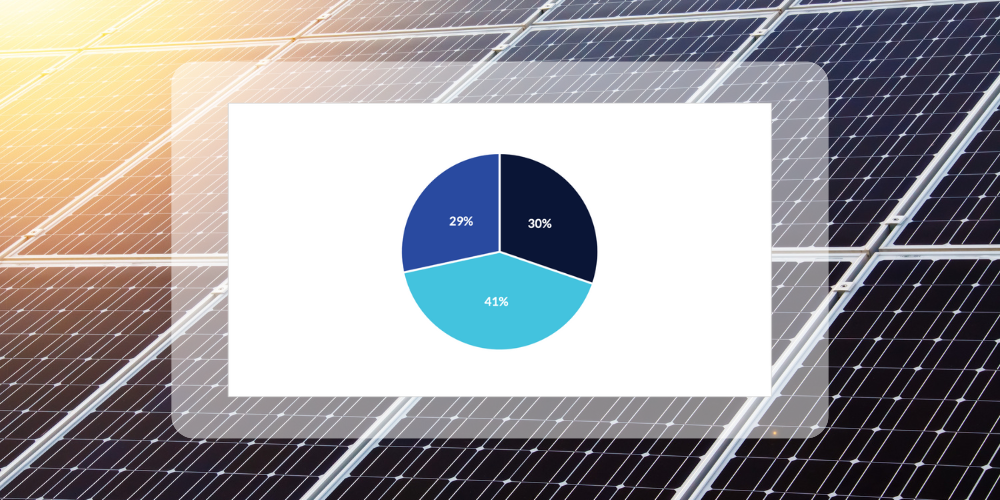
As solar energy capacity grows, so too does the rate and associated damages of natural catastrophes at solar farms. According to Clir’s data, natural catastrophes (excluding hail) are responsible for 51% of costs related to risk per year, although they’re only responsible for 30%* of total risk incidents. In the U.S., this number is expected to be higher as hail is responsible for a significant amount of damage in the country. In particular, the midwest and Great Plains regions, known as hail alley, see significant hail risks.
According to our data, the top solar risks and they’re associated costs are:
Lightning- Average cost per incident: $73,394
- Percentage of total incidents: 9.8%
- Average cost per incident: $1,205,093
- Percentage of total incidents: 2.3%
- Average cost per incident: $207,417
- Percentage of total incidents: 10.0%
- Average cost per incident: $20,535,584
- Percentage of total incidents: 0.4%
Inverter damage
- Average cost per incident: $42,483
- Percentage of total incidents: 17%
Based on project location, technology, and site characteristics, Clir’s platform generates a comprehensive ranking of top risk and associated best-practice mitigations. For example, inverter repairs can cause significant downtime as parts need to be shipped to the farm. Availability of spare parts can significantly impact downtime and business interruptions claims for farms at risk of inverter failures. Alternatively, if the farm will be subject to frequent hail storms, mitigations can being in the asset development phase by using hail resistant PV panels.
Identifying solar losses
Understanding solar losses is critical for understanding why a project may or may not be meeting its budget. Quantifying both uncontrollable and controllable losses contribute to this explanation and there is opportunity to optimize asset performance by analyzing controllable causes.
Analyzing where farms are experiencing losses starts with quality event data. Although OEMs track events on their internal systems, the accuracy, consistency and availability vary across OEMs and models. For transparency into underperformance and losses, Clir developed detectors for a more detailed categorization and quantification of lost energy. These detectors enable Clir’s clients to identify events and associated lost energy even if the project fails to accurately track causes of underperformance or outages.
Clir has nine detectors that constantly analyze the data that gets ingested onto the Clir platform which include:
- Snow: Highlights any energy losses associated with snowfall on the panels.
- Soiling: Highlights energy losses associated with soiling, including any dust or grim on the panels.
- Tracker: If a solar farm has trackers, the detector will detect when the tracker becomes stalled or does not properly follow the sun.
- Temperature: Clir's temperature loss detector will identify when there is a high cell temperature and quantify the temperature loss.
- Curtailment: Clir’s curtailment detector analyzes inverter farm and utility level data to detect losses due to curtailment.
- Grid cap: The grid cap detector tracks losses associated with lost energy due to contracted AC capacity with utility providers.
- Clipping: Analyzes inverter data to identify when inverters are being clipped and quantify the lost energy associated with this event.
- Combiner: Analyzes combiner and inverter level data to detect inverter underperformance through combiner malfunctioning.
- AC subsystem: The AC subsystem detector analyzes farm level data to detect site wide outages due to transformer or switchgear related issues.
- Inverter: Highlights when the inverter is operating in a full capability state, a partial capability state, or a forced outage/non-operative state.
Losses vary per farm, but Clir’s detectors were developed with the top solar losses in mind. Owners and asset managers need to dive into the specific losses identified on their farms to understand what can be done to increase performance.
Diving deeper into risks and losses
Over the next few weeks, we will be leveraging our data for an in-depth dive into the top risks and loss categories that Clir’s data has identified. Equipped with this information, stakeholders, owners and asset managers will be able to better manage risks and losses on their solar farm.
*Not including hail incidents
**Only includes U.S. risk data